
Momentum Indicator White Paper
Momentum Indicator White Paper
What is the momentum indicator? Why it matters to investors?

Principles
In his book, Principles, Ray Dalio highlights his investment logic as devoid of predictions. Instead, it leverages data-driven historical research to understand the relationship between macroeconomic statistics and market movements. Armed with this knowledge, he identifies the current macroeconomic environment and invests into asset classes that have historically performed well during those periods. For example, in times of low growth and high inflation like the 1970s, assets like Gold and Commodities perform well (see far left axis in graphic below).
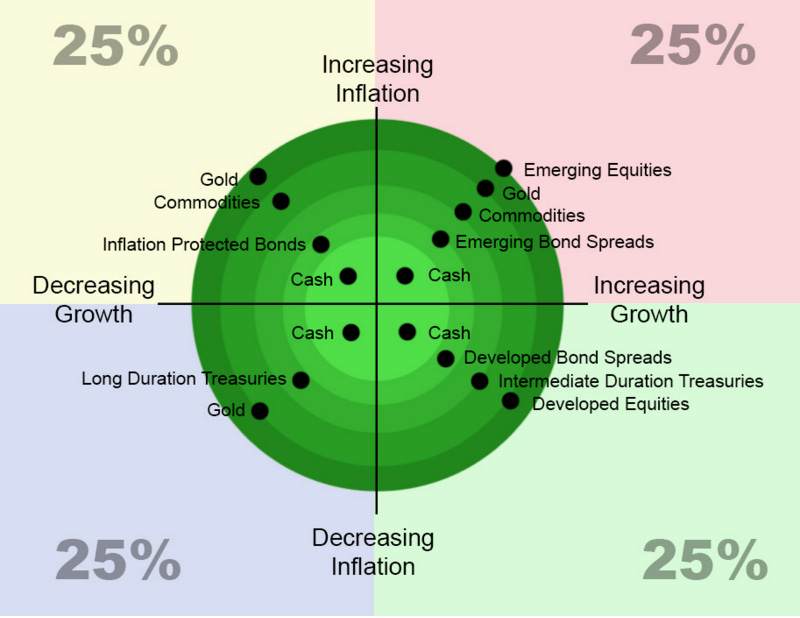
Source: https://macro-ops.com/ray-dalio-portfolio-allocation-strategy-holy-grail/
Application to the Crypto-Market
Using Dalio’s logic, a similar approach can be created within the crypto-markets by spotting price trends, i.e. bull or bear markets, rather than forecasting prices. Once the trend is identified, investors can then position their portfolios accordingly based upon risk tolerance.
Basic Drivers of Cryptocurrency Prices
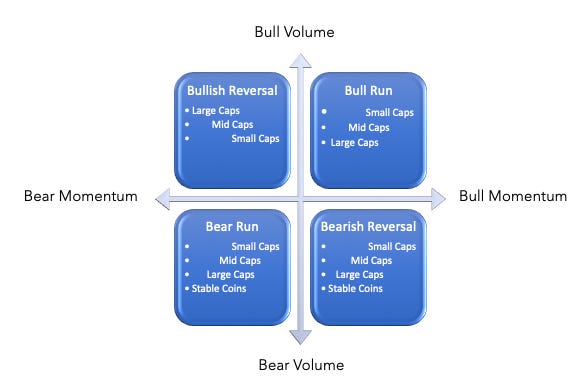
Like Ray Dalio’s macroeconomic breakdown, the crypto-market’s price drivers can be broken down, most simply, into the relationship between directional volume and momentum.
At Valiendero Digital Assets, we model momentum with two indicators built upon mathematics and machine learning — momentum and risk indicators.
Momentum indicator is longer time frame (months), i.e. macro, and risk indicator is shorter time frame (weeks), i.e. micro.
Both quantitative indicators have a value between 0 and 1 with certain levels providing key insights.
Value > 0.65 — A price decline of at least 15% is forthcoming (overbought)
Value < 0.35 — A price increase of at least 15% is forthcoming (oversold)
The easiest way to interpret the above information is that each indicator’s value is the probability of either a bull or bear reversal occurring.
For example, a momentum indicator value of 0.70 is equivalent to saying “There is a 70% chance of a bearish reversal.”
Or, a momentum indicator value of 0.20 is equivalent to saying “ There is an 80% (1 - 0.20) chance of a bullish reversal.”
Statistical and Backtest Results
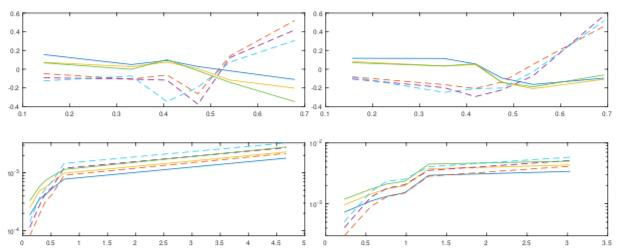
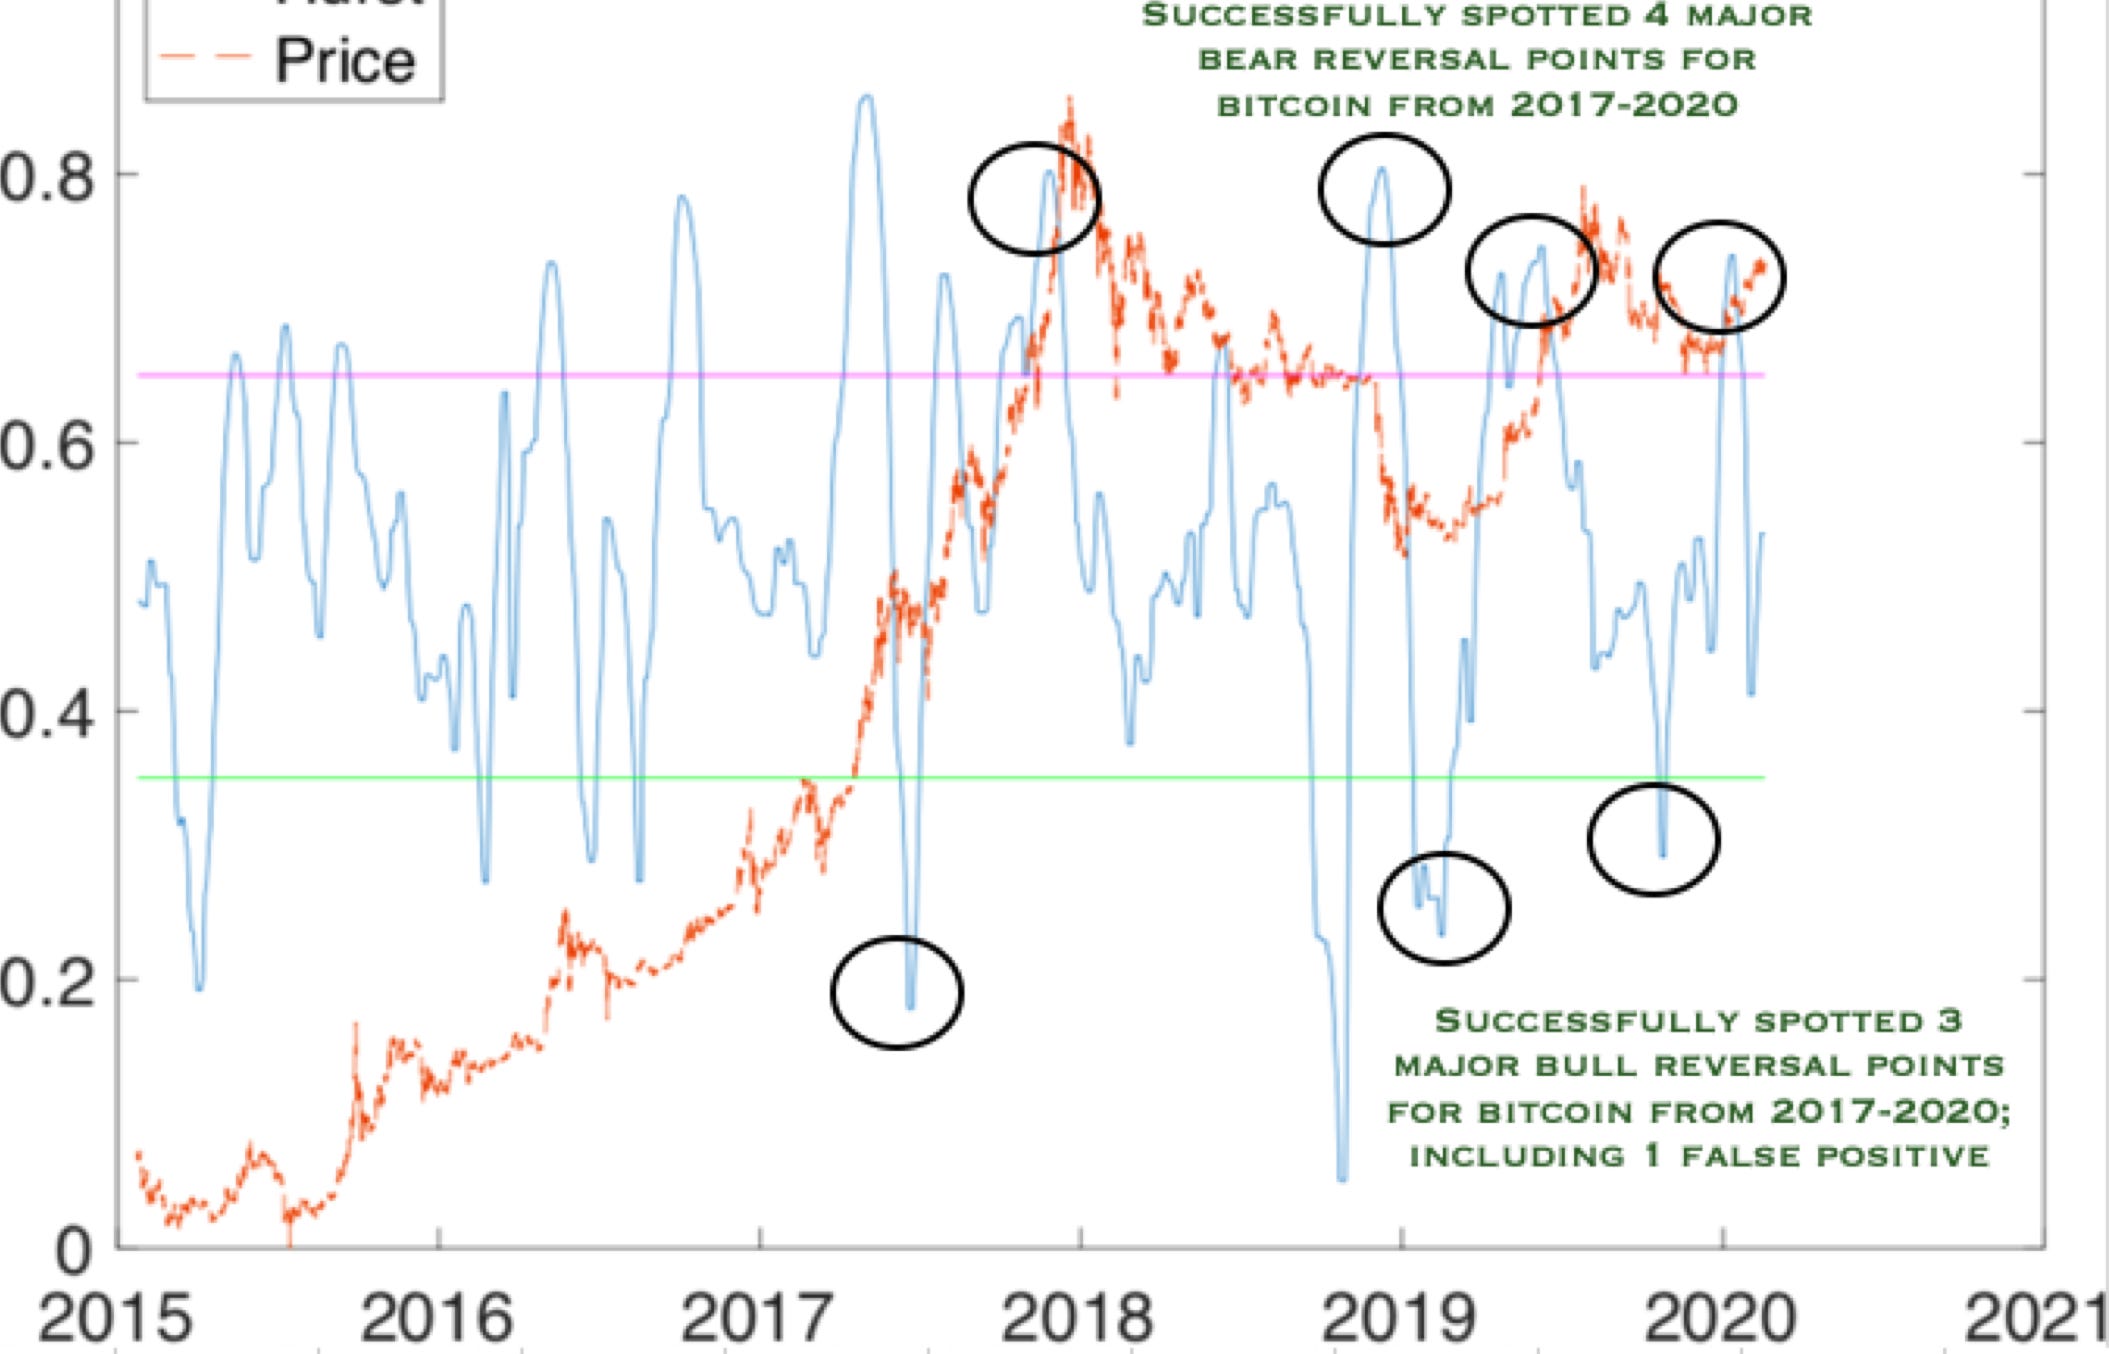
Statistical analysis on digital asset data, e.g. bitcoin, beginning 2014, show a strong trending tendency within the data structure. Per our analysis, the longer time frame of bitcoin shows significant correlation to change in price.

Further analysis revealed that key levels, i.e. 0.35 and 0.65, offer strong insight into bitcoin’s next price movements, which can be seen from growing correlations at different levels.
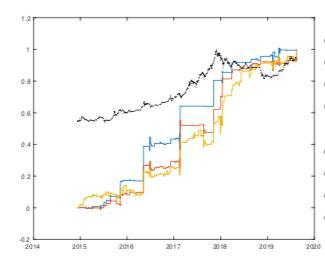
Initially, we verified potential profitability and efficacy through a simple investment scheme whereby you buy or sell (short) once a key level has been reached, and immediately sell 20 hours later. The simple scheme (below), showed strong results over the time period tested, 2015 to 2019, with particularly solid performance in 2018’s crushing bear market.
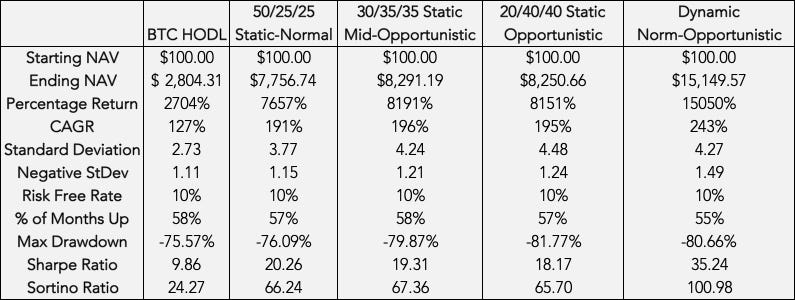
Additionally, we wanted to further backtest the results of the momentum indicator (MI). We chose to compare a dynamically adjusted portfolio using MI versus three statically weighted portfolios with differing allocation percentages and yearly rebalancing.
All portfolio strategies were long-only for simplicity. The dynamic portfolio composition was as follows — bitcoin, ethereum, and litecoin, and normal allocation weights of 50%, 25%, and 25%, respectively, and opportunistic weights of 20%, 40%, and 40%, respectively. Portfolio weights were dynamically adjusted from opportunistic to normal, and vice versa based upon MI producing a reversal signal for bitcoin. The testing period is from January 1, 2015 to January 28, 2020.
Using our dynamic strategy, we increased investment returns, on average, by 87.21% compared to the static portfolios over the testing period. However, the strategy is not without tradeoffs, including increased maximum drawdown and negative standard deviation, and less positive return months. However, despite the aforementioned, the strategy ironically controls capital-loss risk more effectively by trading slightly higher negative volatility for avoidance of dramatic price reversals, while gaining exposure to asymmetrical return opportunities, which is reflected in the Sortino Ratio.
Real-Time Proof of Efficacy
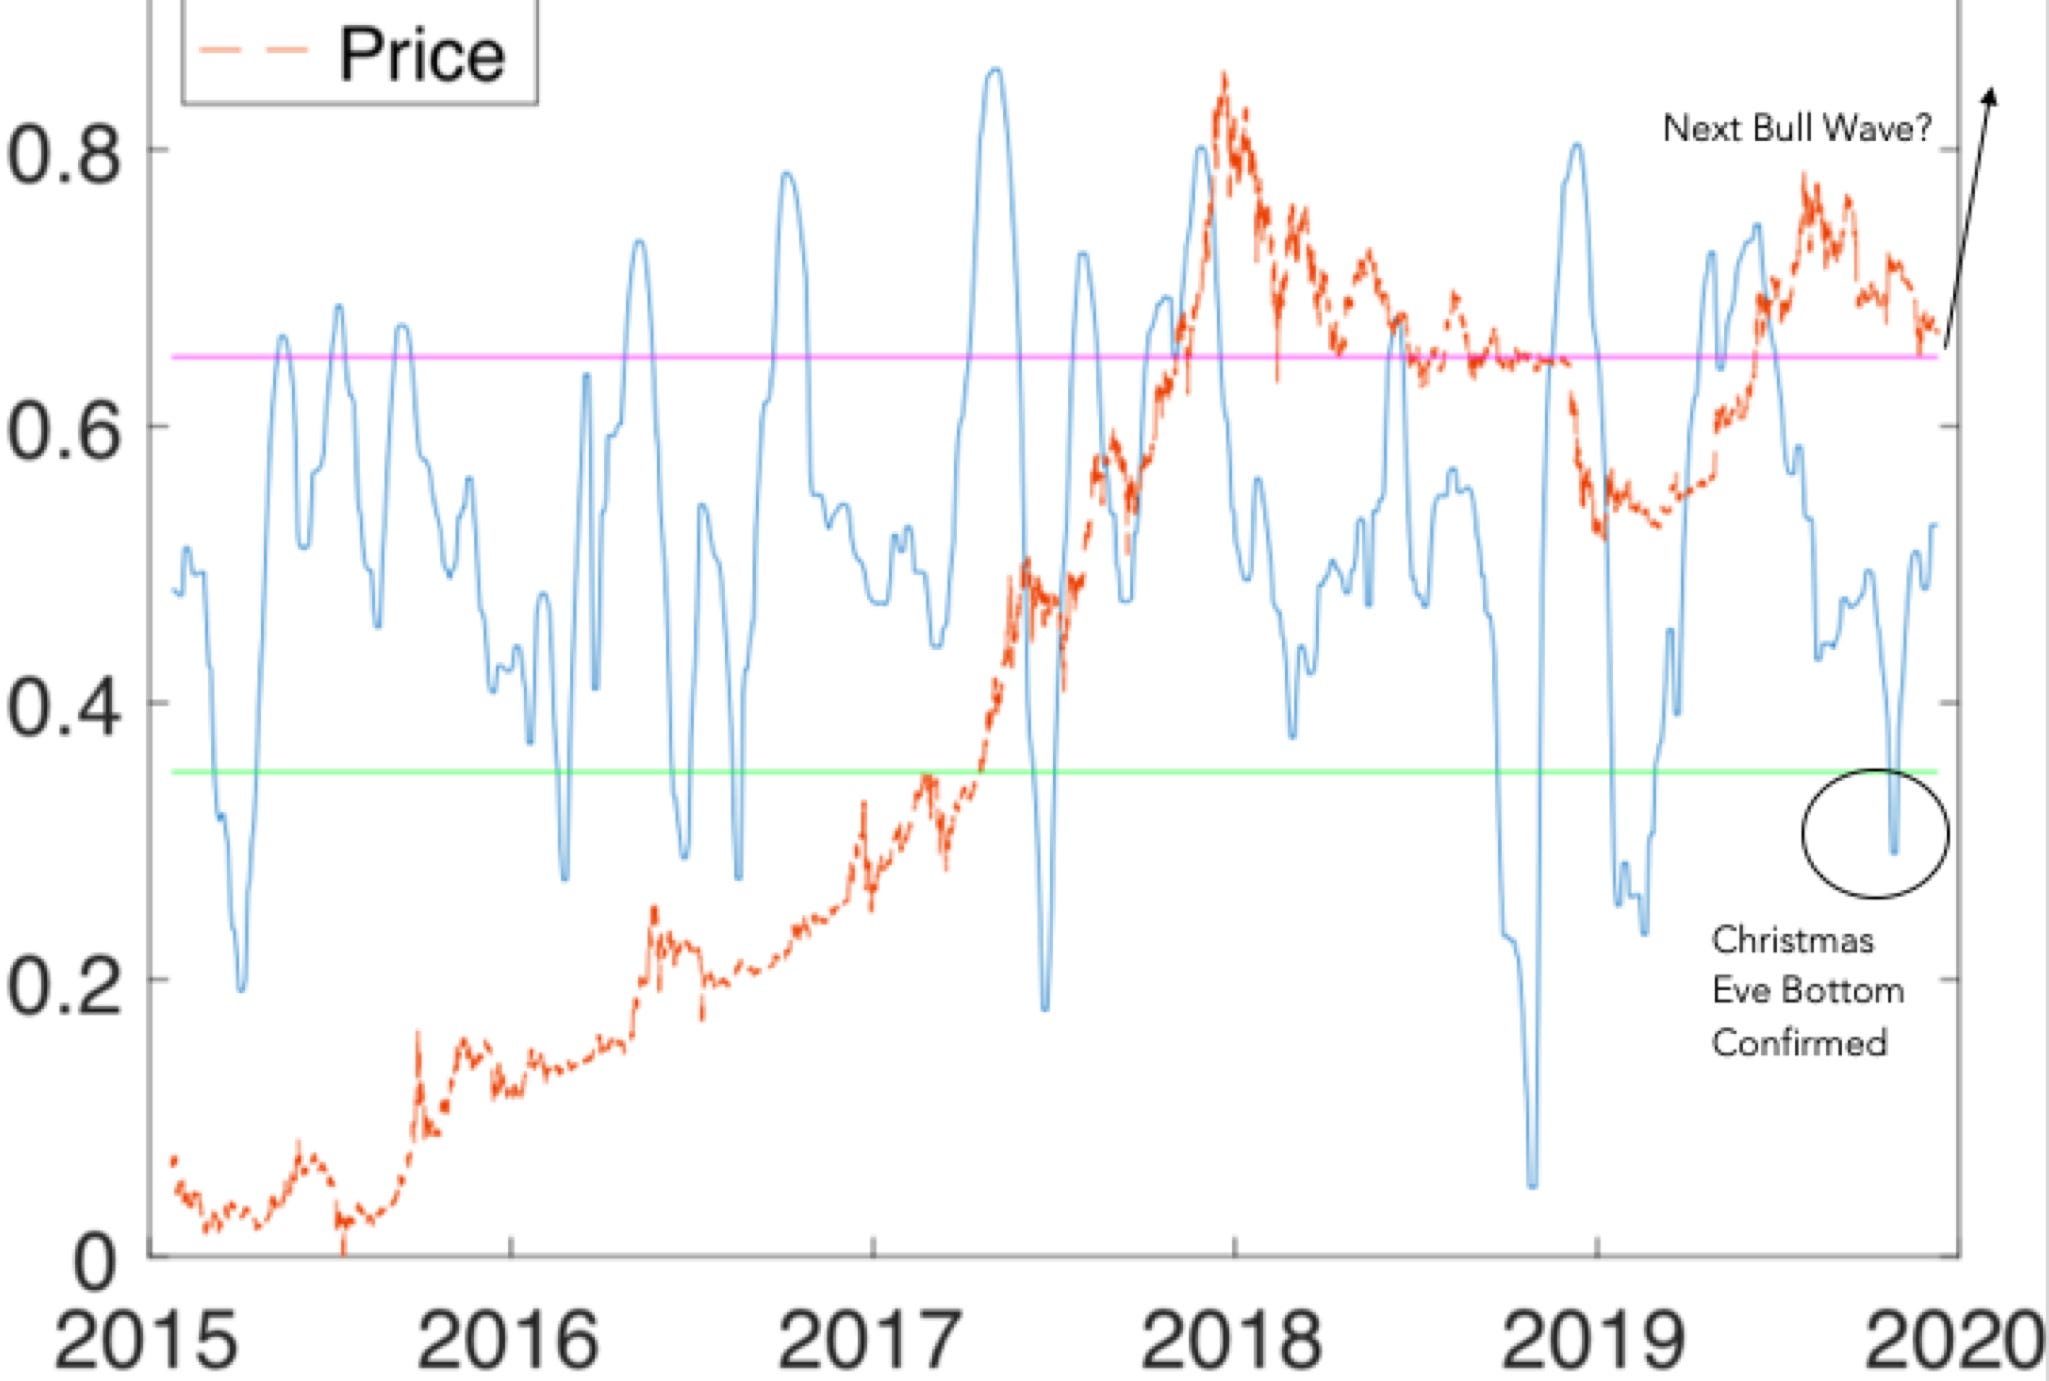
On Christmas Eve 2019, we released an article stating that bitcoin was primed for a bull reversal given the MI was recovering from oversold levels (0.35).
Additionally, in early-March we released a newsletter stating that MI had reached overbought territory and investors should be cautious. Furthermore, the following week’s newsletter highlighted a large price drop, which was anticipated given the MI value.
Application to Retail, Fiduciaries, Stakers, Lenders, and Institutions
Similarly — retail and institutional investors, fiduciaries (financial advisors) on behalf of their clients, and Stakers, have long-time preferences, i.e. primarily buy and hold assets which they expect to appreciate over time. Given the historical expected returns of digital assets, buy and hold strategies appear quite lucrative.
However, in recent years, long-term investors have been exposed to heightened volatility, e.g. +20% month followed by -30% month, which may invoke emotions or investment mandates to exit positions, despite still believing in the long-term viability of the asset.
The momentum indicator, along with risk indicator, are designed to offer an intelligent risk management solution, rooted in mathematics, to help long-term investors better manage risk, emotion, and return opportunities.
Three primary scenarios include:
Liquidation - Bearish Reversal
Lock-in profits after a large run-up in order to reallocate capital to less “frothy” assets, or finance future business operations while prices are high.
Hedging - Bearish Reversal
Desire to mitigate downside risk given run-up in prices, but must maintain current investment positions for tax, staking, or other business reasons.
Accumulation - Bullish Reversal
Desire to accumulate or dollar cost average assets at lower prices before a new bull cycle initiates given long-term conviction.
Summary
The momentum and risk indicators are not crystal balls, but rather intelligent risk management solutions that offer investors and stakeholders a better understanding of when market momentum is on their side and when it is about to switch against them.
For real-time indicator updates, please follow us on Telegram — https://t.me/valiendero_signals.