
Weekly Jab: Edition #12
Weekly Jab: Edition #12
Volatility picks up ahead of election, but risk indicators remain unchanged

Announcements
New Forbes Articles
Quick Refresher
Our quantitative indicators have a value between 0 and 1 with certain levels providing key insights.
Value > 0.65 — A price decline of at least 15% is forthcoming (overbought)
Value < 0.35 — A price increase of at least 15% is forthcoming (oversold)The easiest way to interpret the above information is that each indicator’s value is the probability of either a bull or bear reversal occurring.
For example, a momentum indicator value of 0.70 is equivalent to saying “There is a 70% chance of a bearish reversal.”
Or, a momentum indicator value of 0.20 is equivalent to saying “ There is an 80% (1 - 0.20) chance of a bullish reversal.”
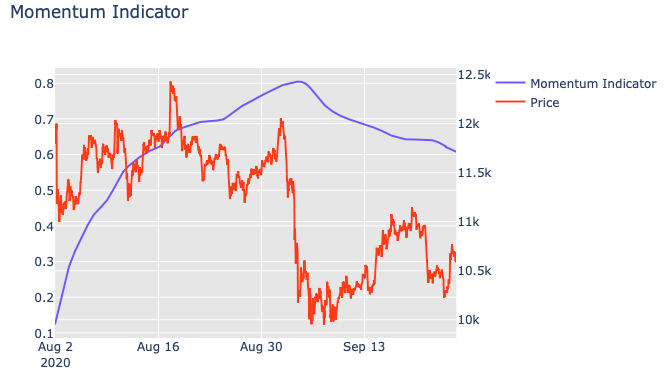
Momentum Indicator
Currently, the momentum indicator (MI) has fallen to 0.61. The current level remains too elevated to signal a sustained recovery in price. Once MI clears (< 0.35), that will present the highest probability of a sustained resumption of the bull trend.
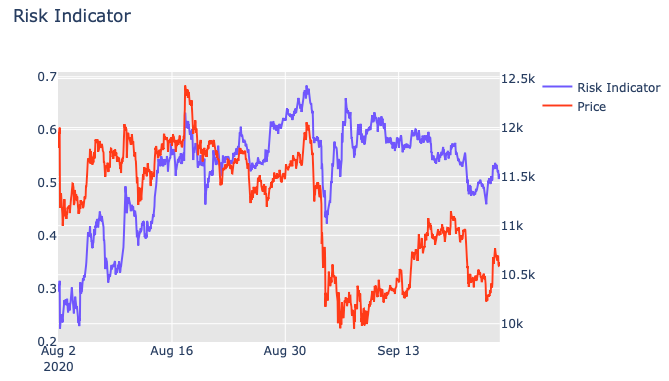
Risk Indicator
The risk indicator (RI) is 0.51, which offers a similar perspective to MI, i.e. too high to indicated sustained recovery.
Last week, a divergence between price and RI appeared, which we noted was likely to re-couple. Monday’s sell-off re-coupled RI and price, and both are trending downward.
Once RI clears (< 0.35), that will present the highest probability of a near-term price recovery.
Technical Analysis
The 4-hour chart has recovered strongly from Monday’s sell-off, including an upward trend in VFI that is approaching 0 (above 0 is bullish). However, price is currently stuck beneath the Kumo Cloud and struggling to tackle Cloud resistance.
Also, RSI appears to be falling in line with a larger downtrend that began last week. Overall the technicals are mixed.

The 1-day chart offers a similarly mixed outlook. The VFI remains above 0, which is very positive given the recent weakness. However, despite RSI bouncing from oversold territory last week, it has fallen back into the downtrend that began at the beginning of August.
Additionally, price has used Cloud support levels twice and remains confined within the Cloud, which has resulted in price eventually falling out of the Cloud, in recent times.
Last, the region of the Cloud that price is confined within is narrowing. Current range is $10,300 to $11,200, but will eventually narrow to between $10,500 and $10,800. Thus, volatility may dampen over the coming days before a stronger breakout is determined.

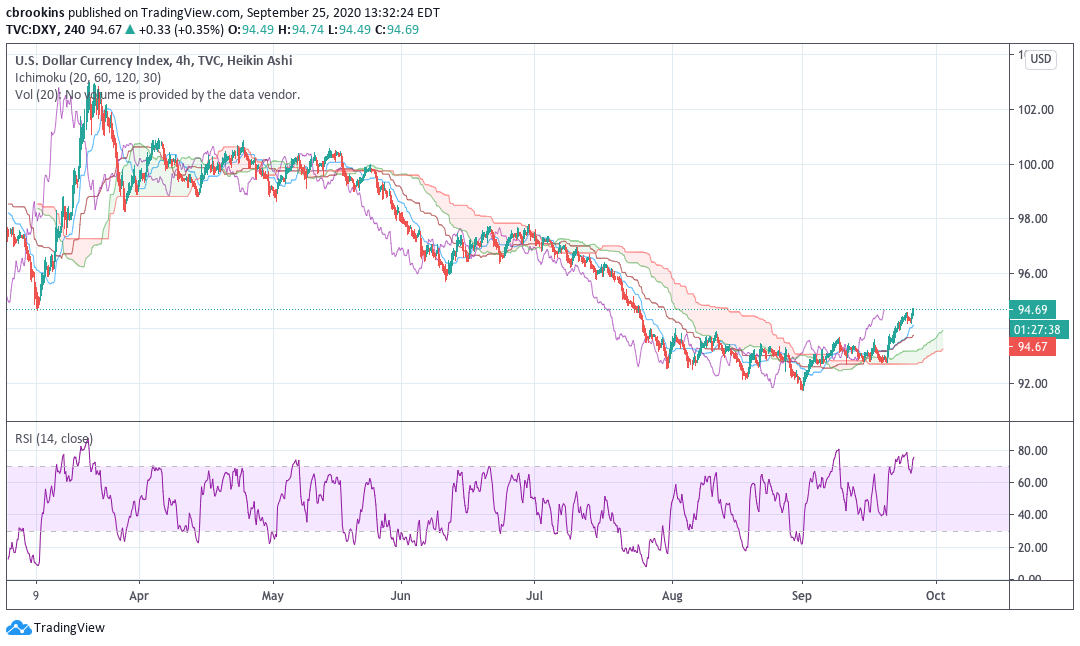
Macro Correlations
On the 4 hour chart, the dollar index (DXY) has finally confirmed a Kumo breakout this week. The recent strength in the dollar has helped hold bitcoin down, although it has been more resilient than expected.
At the current moment, the dollar appears poised to rise higher next week, possibly looking towards $96 as a target. If so, it will undoubtedly weigh on the price of bitcoin.
Summary
The momentum and risk indicators offer a cautious outlook whereas technical analysis and dollar correlation offer a mixed outlook in the near-term.
However, bitcoin’s resilience has been remarkable, even on down days, thus price may range trade before its next leg higher, once the quantitative indicators clear.
As always, we will continue to provide real-time updates in the Telegram channel when they become available. Sign-up here.
Onward and upward,
Chris
-----