
Weekly Jab: Edition #7
Weekly Jab: Edition #7
Long-term bull intact, but near-term retrace seems likely

“Once we realize that imperfect understanding is the human condition there is no shame in being wrong, only in failing to correct our mistakes.”
- George Soros
Announcements
New Podcast Episodes
Valiendero Telegram Channel
Signup for the Telegram channel here for real-time indicator alerts and trading system signals.
Momentum Indicator
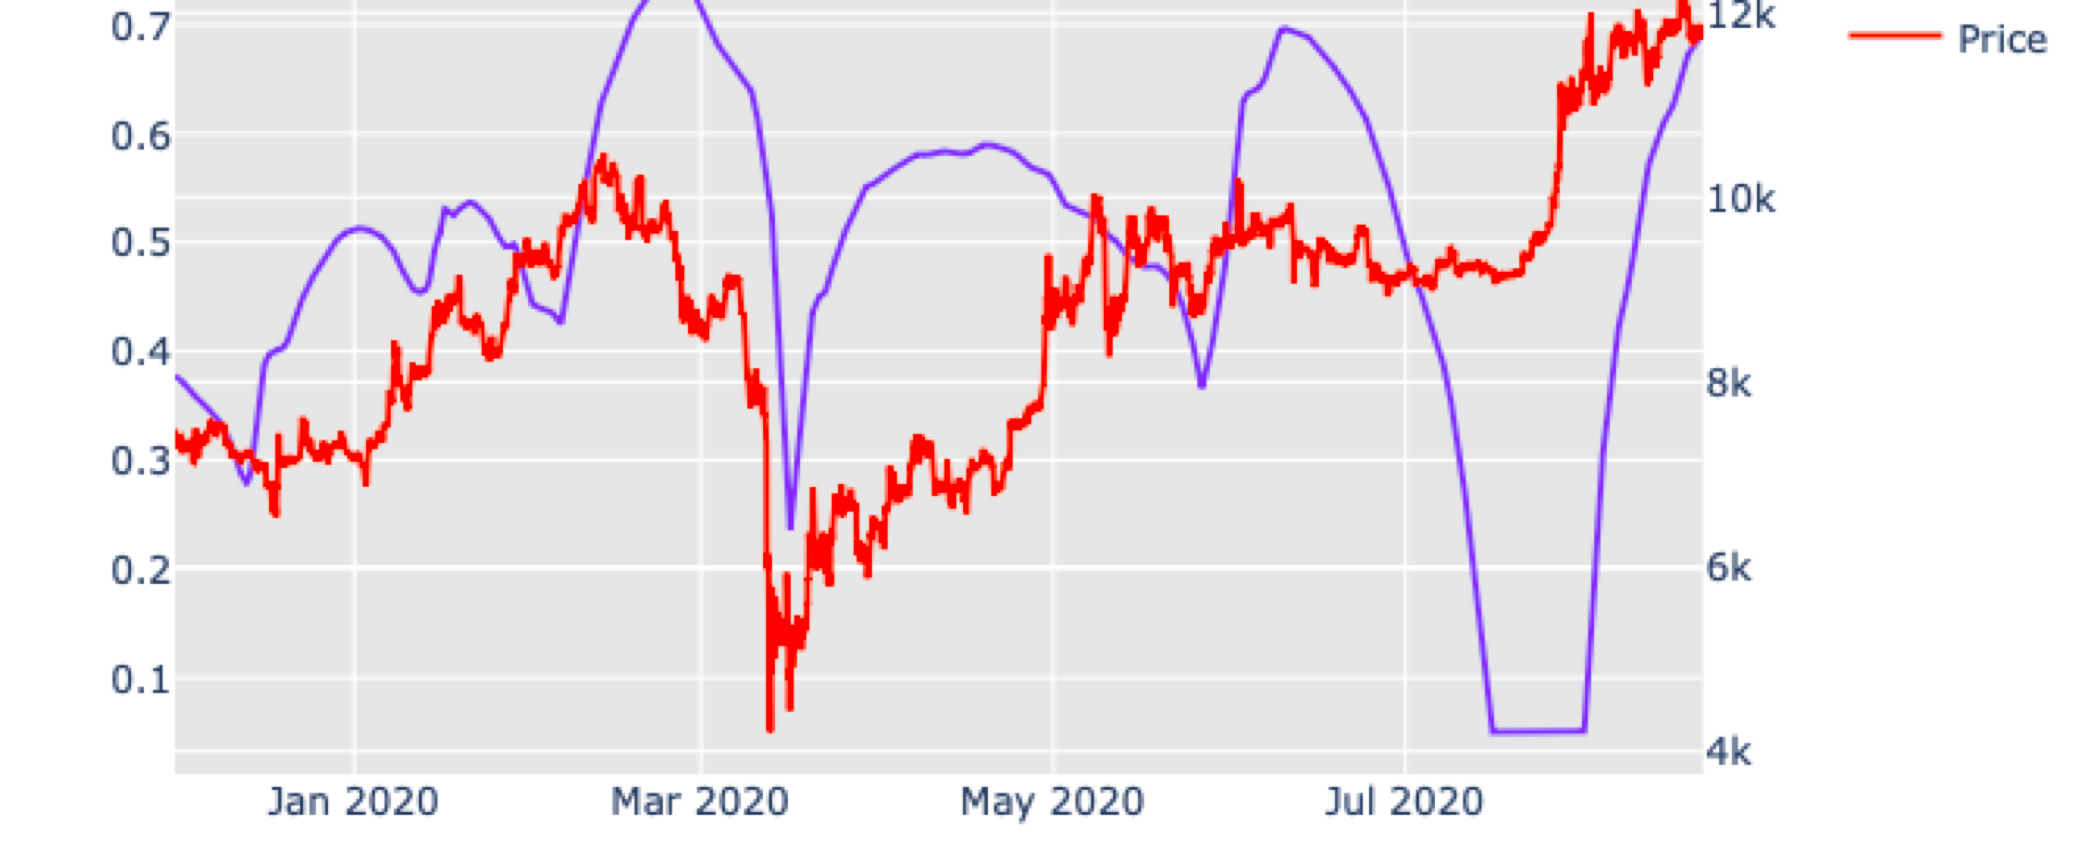
The momentum indicator (MI) has reached overbought territory, currently sitting at 0.69. MI could continue higher before reversing, e.g. MI peaked at 0.74 in late-February 2020. However, the current reading suggests caution despite the current bullish sentiment.
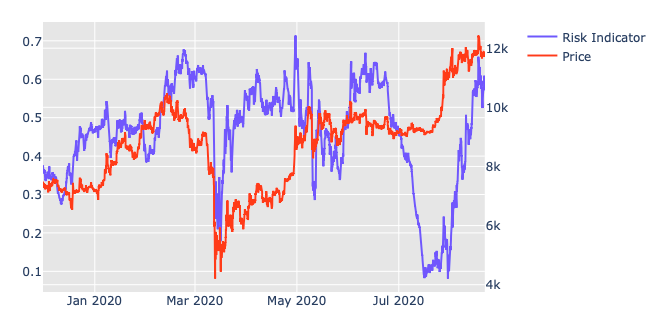
Risk Indicator
The un-smoothed risk indicator hit 0.65 earlier in the week, coinciding with bitcoin’s decline to $11,600, which subsequently dropped the indicator’s value to 0.52. At the time of writing, the indicator has bounced back up to 0.60. Given the current bid in the market, the indicator is likely to travel back to 0.65 or above, at which time we expect additional price weakness.
Technical Analysis
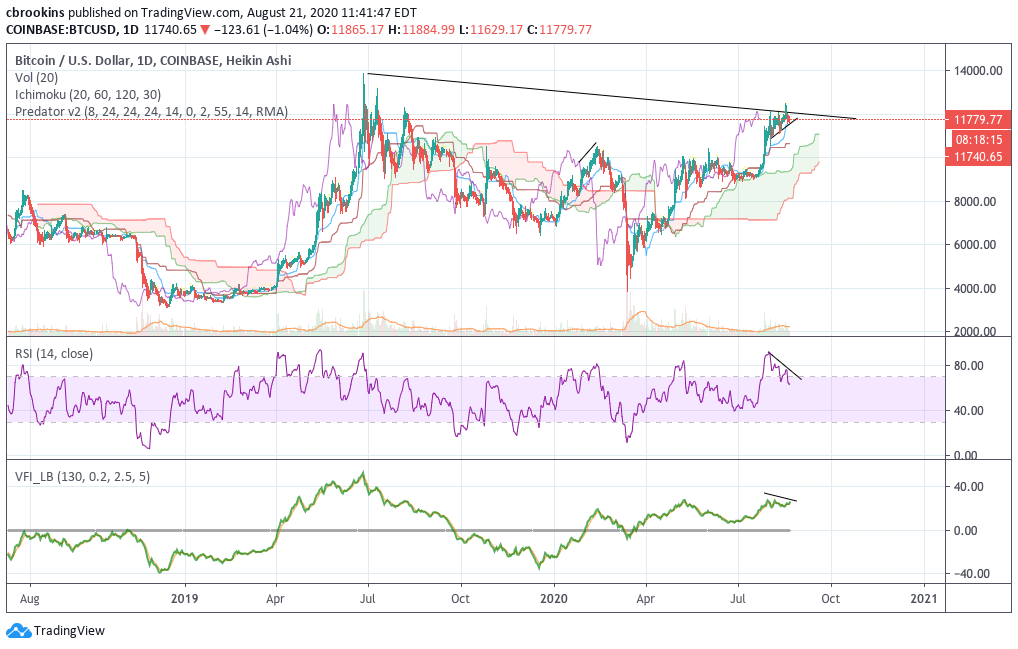
At the time of writing, bitcoin has stemmed the bleeding from its false breakout above $12,400 back to $11,600, currently trading at $11,750.
However, the 1-day chart looks weak at best. Price remains well above the Kumo Cloud, but both RSI and VFI are showing bearish divergences. The aforementioned divergence could see bitcoin retest lower support levels of $11,000 in the near-future.
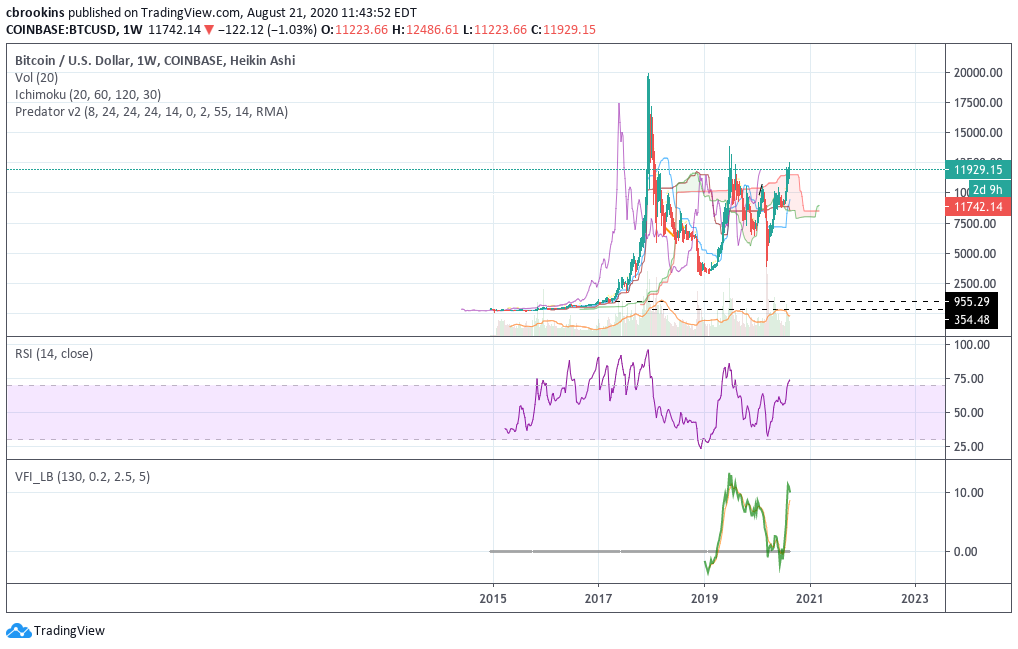
The weekly chart remains bullish as long as price stays above $11,500, i.e. the Kumo Cloud support. The weekly close this Sunday will be closely watched by market participants.
If price falls back into the Cloud, $11,000 in the near-future is all but assured. If price stays above $11,500, then reclaiming $12,400 remains on the table.
Macro Correlations
In recent months, the correlation between Equities and Gold has grown. In our opinion, bitcoin is an early stage store of value, which is seen by its positive correlation to Gold and negative correlation to the US dollar (see below).
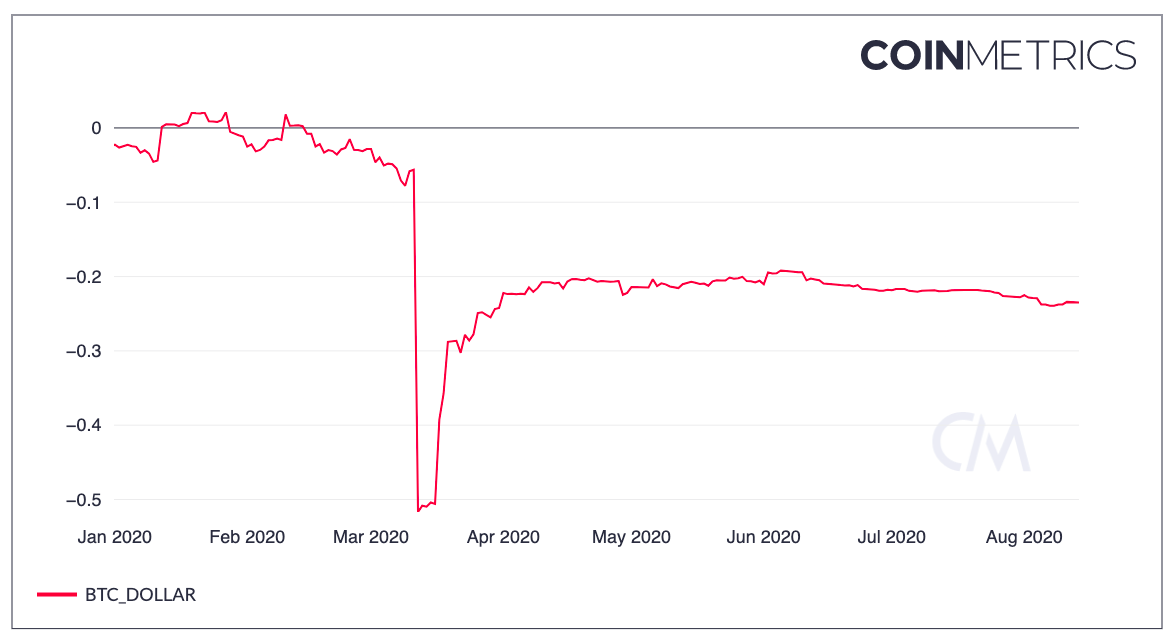
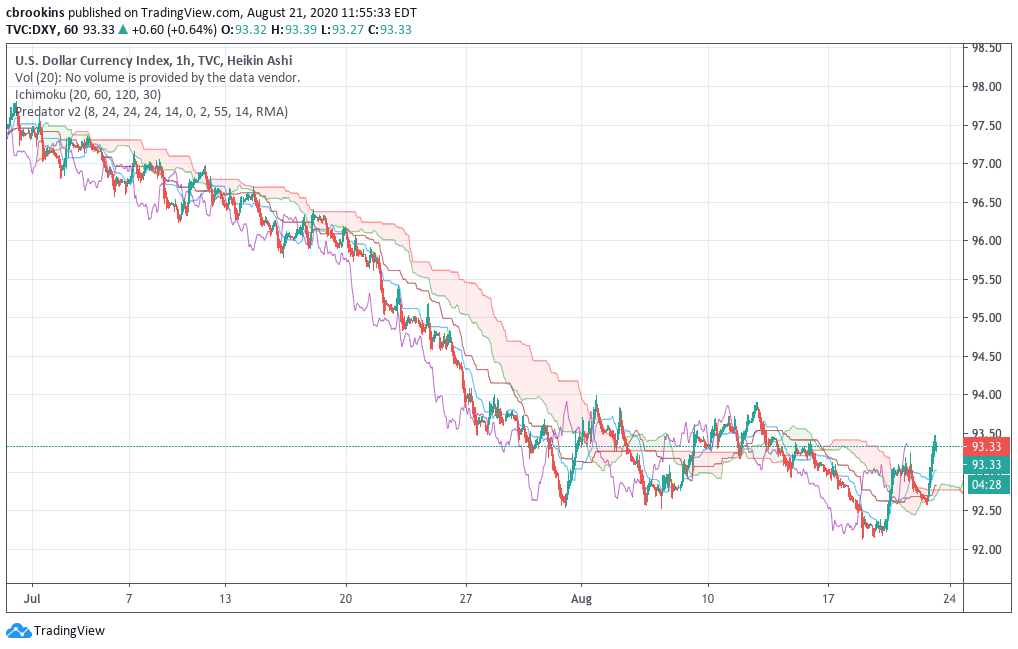
The growing negative correlation between USD and bitcoin validates the store of value narrative, but puts bitcoin at the mercy of macroeconomic swings. For example, since July, USD has been headed strongly downward, which has been a boon to bitcoin price. However, at the time of writing, USD is teasing a near-term reversal with a recent Kumo breakout on the 1-hour chart.
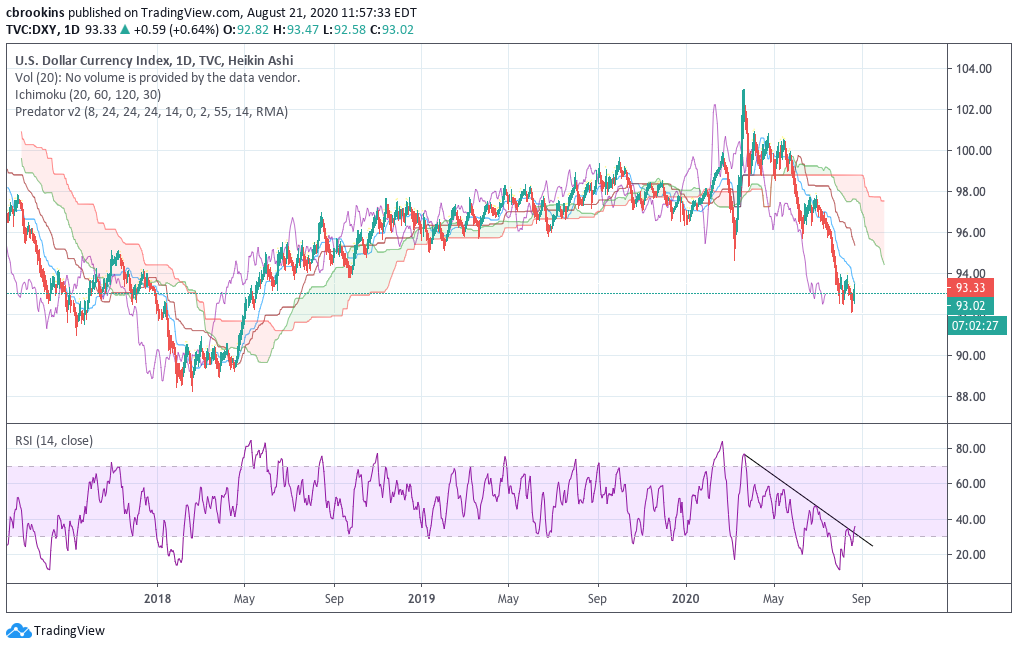
Additionally, on the 1 day chart, RSI is recovering from deeply oversold conditions and teasing a breakout from the descending line. The confluence of short and long-term charts seem to suggest that the USD might catch a bounce in the near-term, which could be negative for bitcoin price.
Fundamentals
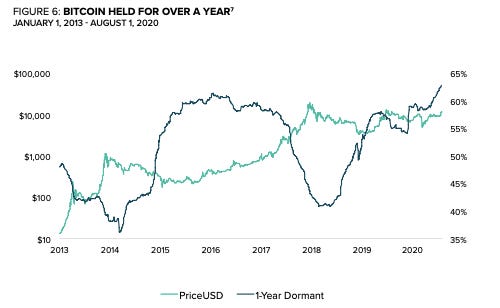
Despite the growing negative correlation between USD and bitcoin, the fundamentals for bitcoin have never looked better. Per Grayscale’s “Valuing Bitcoin” Report, both demand and supply side metrics favor a sustained bull market.
Per Grayscale’s supply side analysis, only 37% of all bitcoin are actually available for trading. The remaining amount has not been touched in over 1 year.
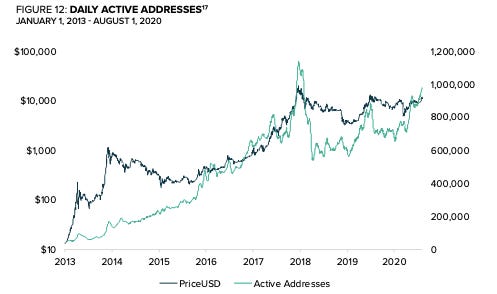
Per Grayscale’s demand side analysis, active addresses (unique addresses per day on the bitcoin network) have continued to grow linearly since 2013, and currently sit around 1 million.
Summary
The Momentum and Risk Indicators, Technical Analysis, and USD correlation all suggest that a near-term reversal is on the horizon for bitcoin.
However, the longer time frame Fundamentals and Charts suggest that the reversal might be limited to a healthy price retracement rather than a full-fledged bear market. Thus, maintaining the current bull market environment.
As always, we will continue to monitor our analytics and provide real-time updates in the Telegram channel when they become available.
Onward and upward,
Chris
-----