
Weekly Jab: Edition #8
Weekly Jab: Edition #8
Bitcoin at a crossroads, but which path will it take?

Announcements
New Podcast Episode
New Forbes Articles
Momentum Indicator
The momentum indicator (MI) continues to push higher despite recent price weakness for bitcoin. MI sits at 0.74, i.e. the level in which it peaked back in late-February 2020. MI has yet to “top”, which provides the highest probability signal of reversal, but the elevated reading has signaled caution for over a week now, falling in line with recent weakness.
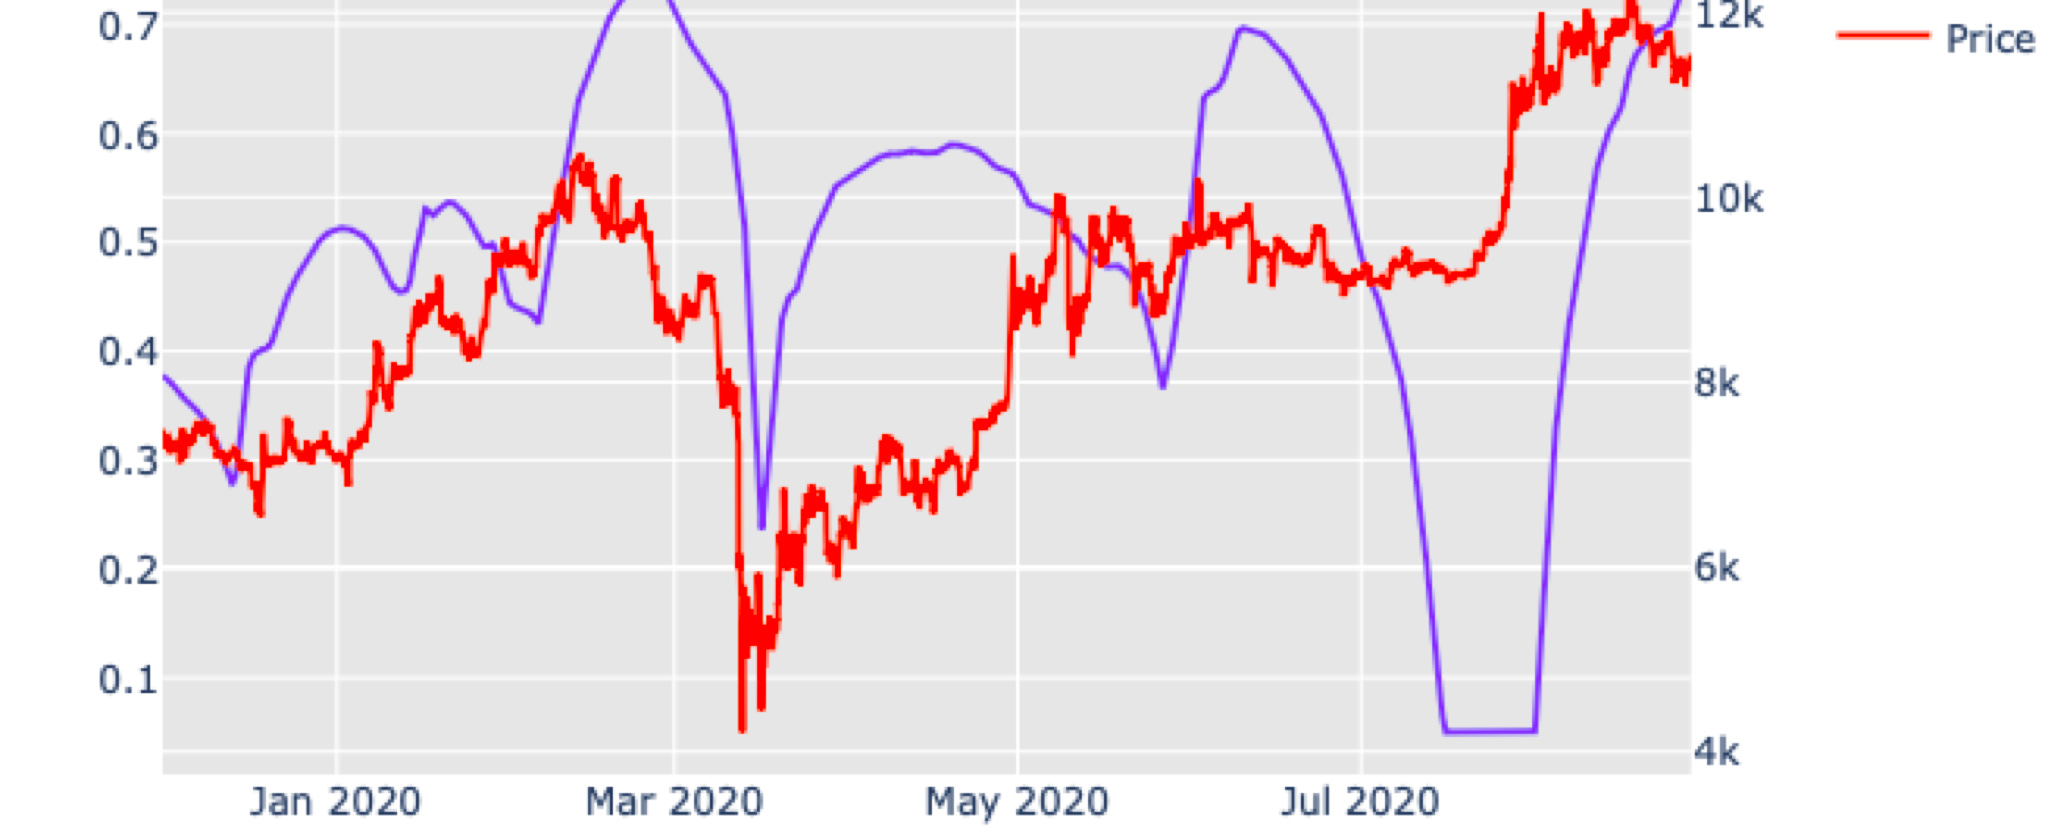
Risk Indicator
The un-smoothed risk indicator is approaching 0.63, thus getting close to overbought levels. Similar to MI, the recent reversal levels have been closer to 0.70. Again, despite the risk indicator not yet “topping,” the value approaching 0.65 signals caution.

Technical Analysis
The current technicals are mixed, but slightly hinting at a bullish bounce in the near-term.
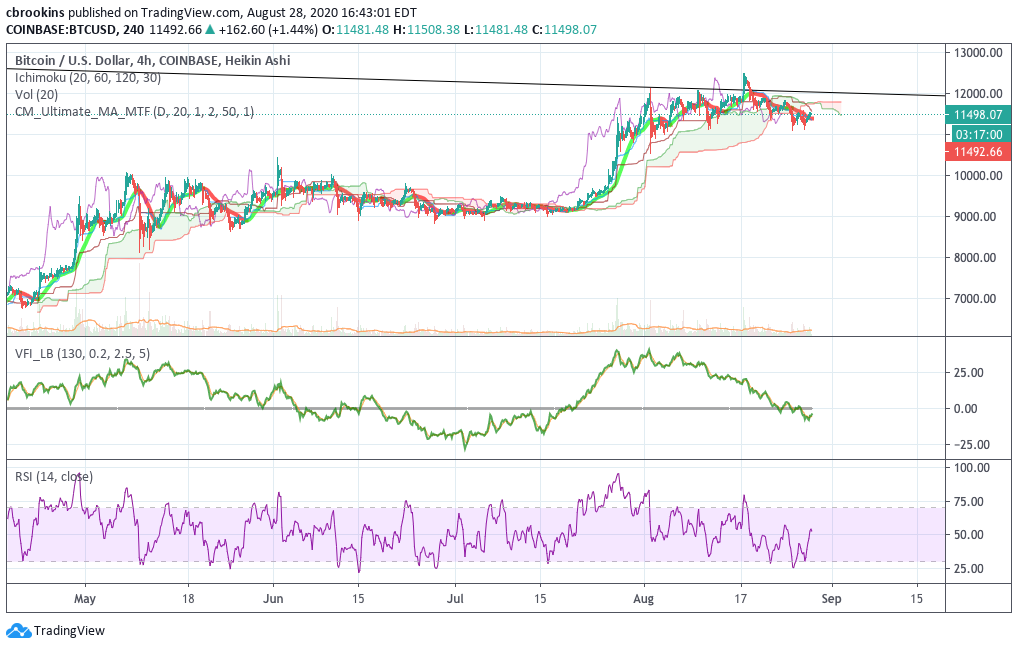
The 4-hour chart is showing a solid recovery from yesterday’s selloff with RSI and VFI both trying to move back into bullish territory. However, price has fallen beneath both Kumo Cloud and Moving Average Bands, which indicates a breakdown of the former uptrend. If price can reclaim its footing above both Kumo Cloud and Moving Average Bands, bitcoin would look primed for another attempt at $12,000.
The 1-day chart offers a similar picture with price recently falling beneath the Moving Average Bands, but still well above the Kumo Cloud. Additionally, both VFI and RSI are declining, but the rate of change has slowed.
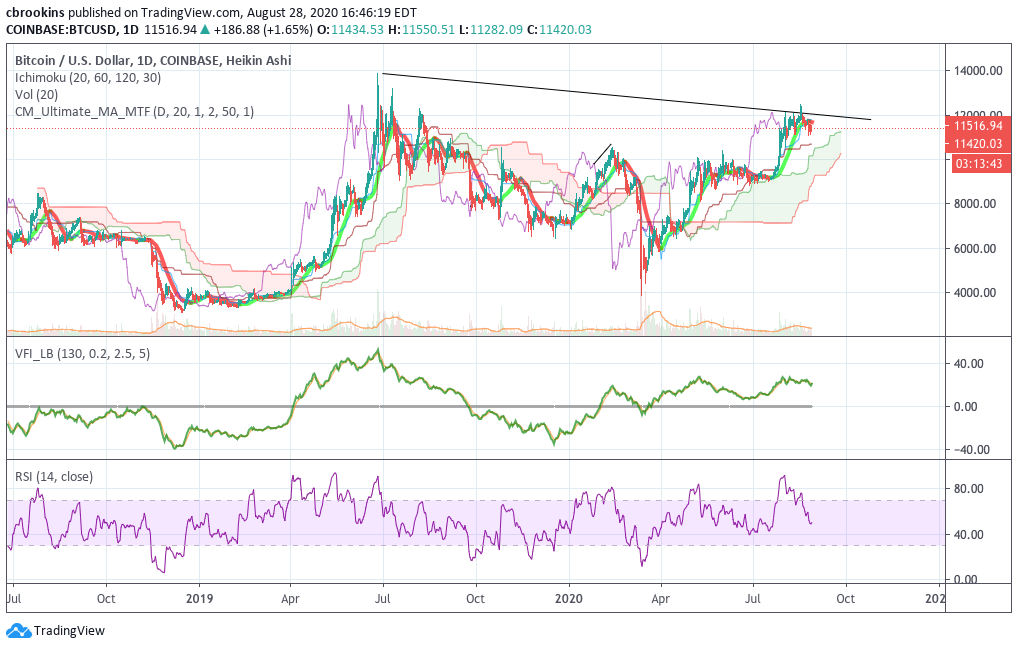
The weekly chart remains bullish, but barely. Currently, price is fighting to stay above the critical $11,500 level. If price closes this week beneath $11,500, i.e. inside the Cloud, that would likely signal further declines ahead. TBD.

Macro Correlations
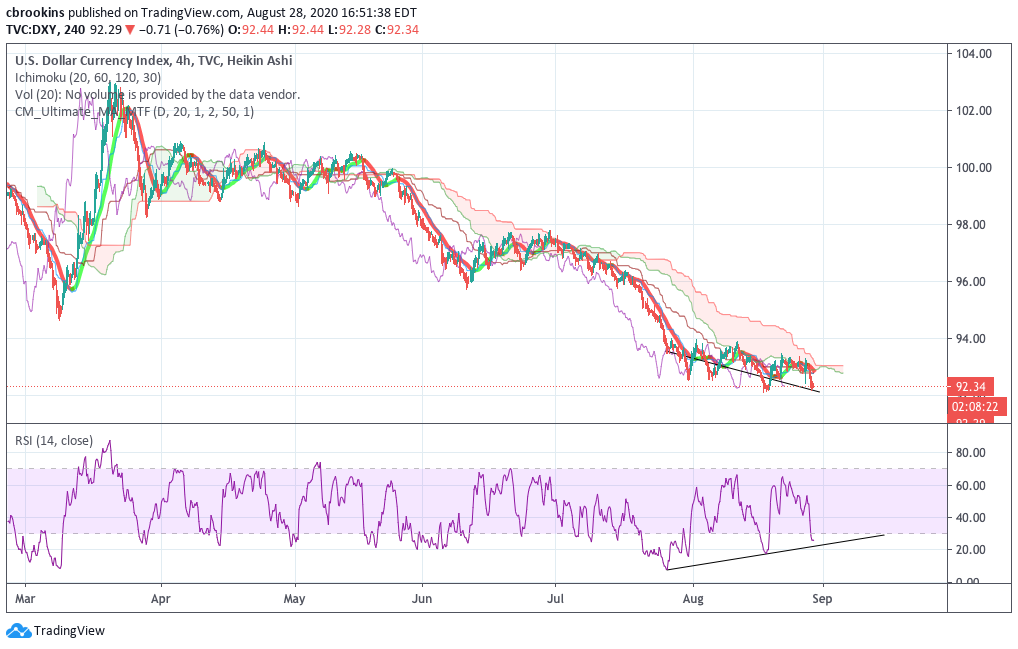
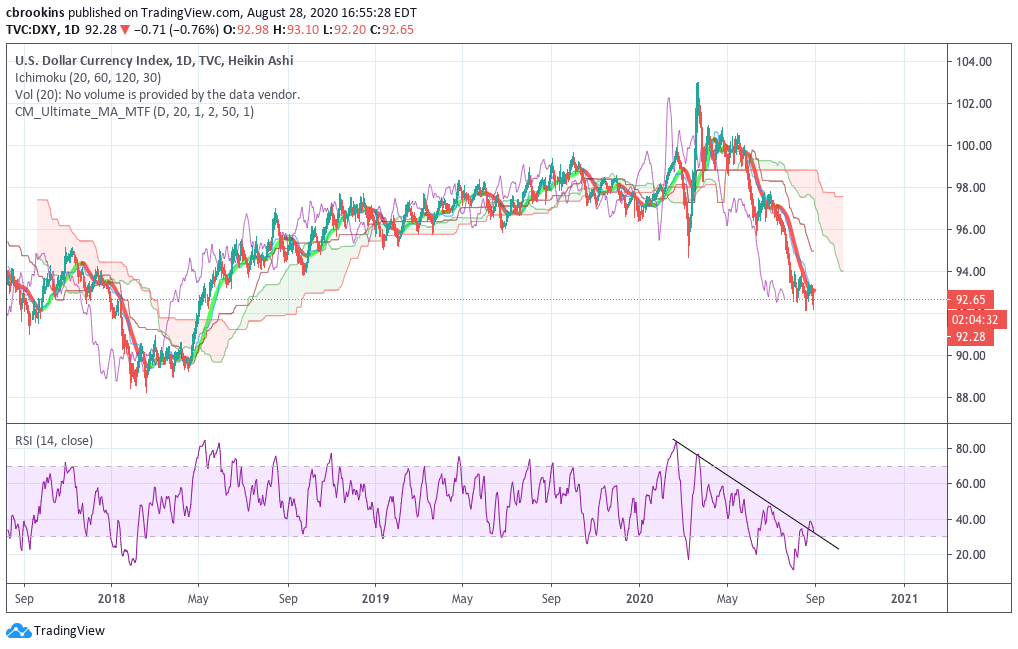
The 4-hour dollar index chart (DXY) took a beating today following the Fed’s announcement of easier inflation policies moving forward, thus de-facto green-lighting the further debasement of the US dollar.
Price is now well beneath the Kumo Cloud and following its existing downward trend. However, a potential bullish RSI divergence still remains, which could enable price to breakout above the Cloud; especially given it has now narrowed considerably. TBD.
The 1 day chart shows price is struggling to maintain its RSI trend line breakout. Furthermore, the Moving Average Bands have acted as strong resistance throughout this down trend. If price can maintain the RSI breakout and climb above the Moving Average Bands, it will initiate an upward leg. However, if it cannot accomplish the aforementioned over the coming days, it is likely to decline considerably, thus boosting bitcoin’s price.
Summary
The momentum and risk indicators offer a cautious outlook whereas technical analysis and dollar index chart paint a potentially bullish picture in the near-term. We’ll closely monitor over the weekend as we expect the market to tip its hand sooner rather than later.
As always, we will continue to monitor our analytics and provide real-time updates in the Telegram channel when they become available. Sign-up here.
Onward and upward,
Chris
-----