

Weekly Jab - Bitcoin Analysis
Downtrend remains, but a break below $9k will invite buyers quickly.

Bitcoin Report
“It’s not whether you’re right or wrong that’s important, but how much money you make when you’re right and how much money you lose when you’re wrong."
- Stanley Druckenmiller
Announcements
First, I have released two Forbes articles this week, which analyze both bullish and bearish narratives surrounding bitcoin in recent weeks. “PayPal Deal Won’t Drive Bitcoin Price Higher” and “Equities Buoy Bitcoin, But Price Headwinds Are Unchanged.”
Second, I released two amazing podcasts - Tyrone Ross of 401 and Brandon “Six Gun” Gibson. Both are highly recommended. Listen on Spotify or watch on Youtube.
Last, signup now for the telegram channel - https://t.me/valiendero_signals.
Momentum Indicator
From a macro perspective, momentum indicator appears to be stabilizing around 0.46. The trend and level still confirm a bearish bias, which has remained since peaking at 0.70.

The continued decline falls in line with estimated hourly volatility's uptick to 71 basis points. Hourly volatility appears to be repeating a pattern last seen late-February to March 11th. We don't expect as dramatic spike in volatility, but a stronger breakout does seem likely.

The momentum indicator and estimated hourly volatility suggest that a breakout in volatility will likely be to the downside, but only time will tell; especially as our risk indicators near oversold levels.
Risk Indicators
From a micro perspective, the un-smoothed indicator continues to fall from its failed attempts at breaking above previous resistance levels. Currently, the risk indicator is plateauing around 0.41. If bitcoin does begin to fall, it is not far from 0.35, thus the fall should not be prolonged in the near-term.

The smoothed indicator continues to decline in value, currently sitting at 0.42. Similarly to the momentum indicator, the current value of the smoothed risk indicator suggests further price depreciation is likely, but a steeper drop will likely touch oversold conditions, thus buoy price.

Technical Analysis
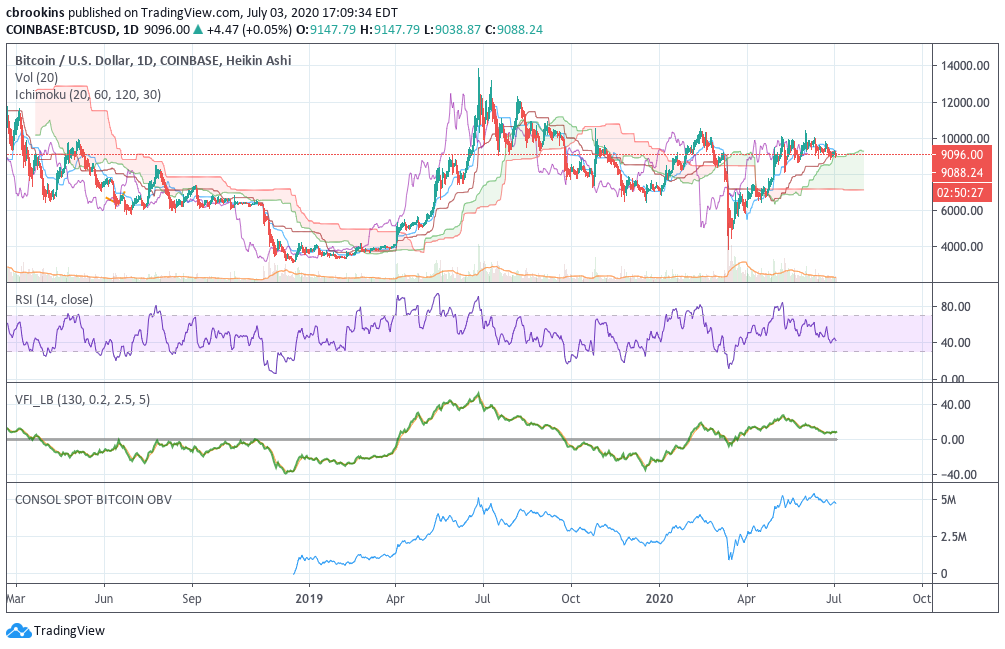
Bitcoin has been confined within a tight trading range between ~ $9,000 and $10,000. At the time of writing, price trades at ~$9,100.
On the 1-day chart, volume flow indicator, on balance volume, and relative strength index have been trending downward strongly since halving, while price has held up rather well.
Principally, the last point of defense has been the large Kumo Cloud support (green cloud), which has been tested several times over the last week. If price finally breaks and holds beneath, i.e. price enters the Cloud, further declines to $8k or even sub-$8k cannot be ruled out.
Summary
The aforementioned analysis suggests bitcoin could receive a near-term price bounce given the strong Cloud support, plus with the un-smoothed risk indicator approaching oversold territory. However, both the momentum, volatility, and technical analysis suggest the overarching trend remains downward.
Onward and upward,
Chris
-----
For Reference:
The momentum and risk indicators are quantitative analytics with a value between 0 and 1. Momentum is longer time frame, i.e. macro, whereas risk is shorter time frame, i.e. micro.
Value > 0.65 — Signals a price decline is forthcoming (overbought)
Value < 0.35 — Signals a price increase is forthcoming (oversold)