

Weekly Jab - Bitcoin Analysis #2
Quant Indicators are flashing bull signs, but a drop may occur first

“I’m only rich because I know when I’m wrong…I basically have survived by recognizing my mistakes."
- George Soros
Announcements
I published Momentum Indicator White Paper, which delves into the research, backtesting, and real-time performance of the primary indicator we reference in our Weekly Jab Newsletters. Enjoy!
Signup for the telegram channel here.
Momentum Indicator
From a macro perspective, the momentum indicator (MI) has fallen to 0.32, officially entering oversold or accumulation territory. However, the highest probability BUY signal does not initiate until it bottoms, i.e. stops declining and begins to trend upward. At the time of writing, the MI has not bottomed, but still may offer an entry signal for more ‘first mover’ type of investors.

All signs point to a bullish inflection point in the future for bitcoin, but the highest probability signal has yet to arise.
Risk Indicators
From a micro perspective, the un-smoothed risk indicator continues to fall and sits at 0.30. However, similar to MI, the highest probability BUY signal is only triggered upon the indicator bottoming.
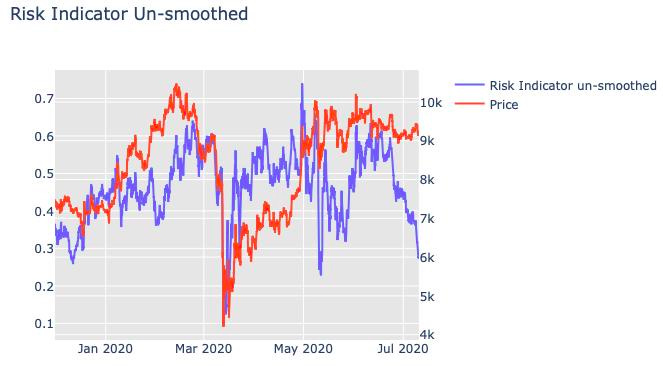
Additionally, the smoothed risk indicator sits at 0.36, thus almost entering oversold territory as well.

Technical Analysis
Bitcoin has been confined within a tight trading range between ~ $9,000 and $10,000. At the time of writing, price trades at ~$9,200.
On the hourly chart, the technical indicators still point bearish with VFI breaking its uptrend and now back below 0. Also, price is now beneath the Kumo Cloud.

The 6-hour chart presents an even worse picture with a clear downtrend in RSI and VFI since halving, including price beneath Cloud resistance.

On the 1-day chart, volume flow indicator, on balance volume, and relative strength index received a bounce this week, but ultimately stayed confined within their downtrends.
However, the large Kumo Cloud support (green cloud) has been tested several times over the past two weeks and showed strong buying interest. If this level can be defended once more with greater buying volume, price may finally breakout to the upside.
However, multiple retests of a support level typically never end well. If price finally breaks below $9,000 i.e. price enters the Cloud, declines into the low to mid $8,000s cannot be ruled out.

Summary
Technical analysis shows that the overall price trend for bitcoin, since halving, has been downward, despite relative resilience. However, as trading volatility has compressed in recent days, an inevitable breakout may loom to the downside in the near-term. However, the Momentum and Risk Indicators suggest that a bullish inflection point is on the horizon.
Onward and upward,
Chris
Thanks,
I want to join d bitcoin buiness,pls give me d guild lines to follow thanks.