

Weekly Jab - Bitcoin Analysis #3
Historical analysis suggests declining quant indicator is bad news for BTC.

“You’re trying to figure out that inflection point.”
- David Tepper
Announcements
First, I published a new Forbes piece, DeFi Boom Has Saved Bitcoin From Plummeting, which explores the notion that yield farming may have offered a subtle undercurrent of buying pressure for BTC over the past 3 months.
Second, I released a new podcast this week with another leading bitcoin quantitative analyst, Marcel Burger, where we discussed all aspects of quant for crypto and developing an institutional-grade bitcoin valuation model.
Last, signup for the Telegram channel here.
Momentum Indicator
This past week, the momentum indicator (MI) has fallen to levels not seen since November 2018, i.e. 0.05. However, despite the precipitous decline, the highest probability BUY signal does not initiate until MI bottoms.

On the surface, all signs point to a possible bullish inflection point in the future for bitcoin.
However, given the dramatic decrease, coupled with minimal price movement, I did a brief historical analysis to uncover additional insights, which could offer a bearish outlook, and potentially dramatic in nature.
The only other example of when the MI value declined so dramatically while price traded so tightly, was November 2018, right before price dropped from $6,500 to $3,400. If history repeats itself, bitcoin could be staring down the barrel of a substantial price decrease.

Risk Indicators
The un-smoothed risk indicator continues to fall and sits at 0.12, and offers similar guidance to MI.

Technical Analysis
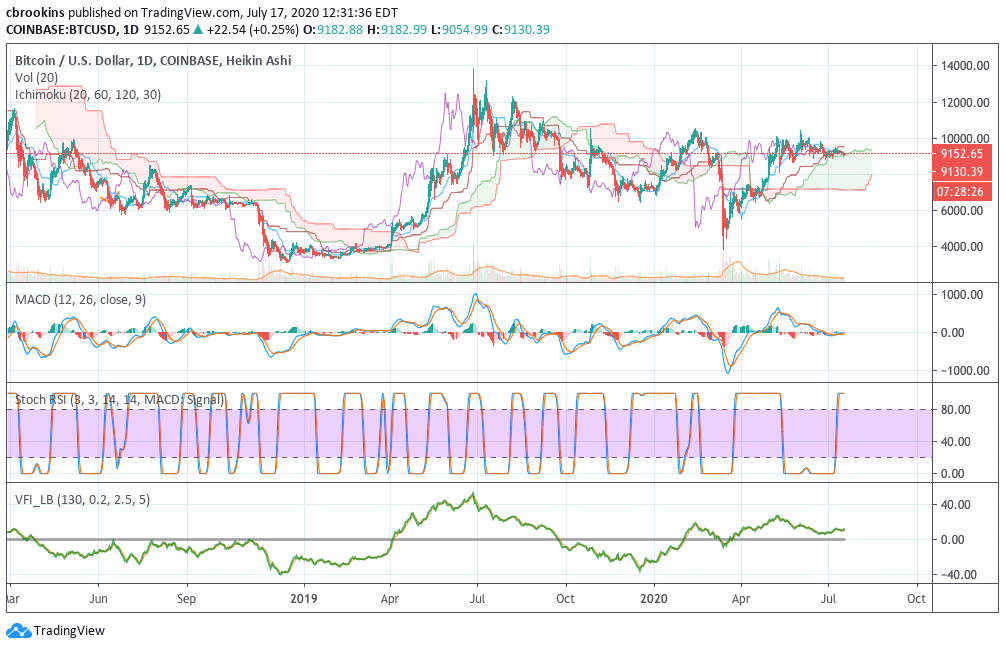
As stated prior, bitcoin’s trading range has continuously tightened over the past two weeks, which inevitably will lead to a large price breakout. At the time of writing, price trades at ~$9,100.
On the hourly chart, the technical indicators are still bearish with price now fighting to re-enter the Kumo Cloud, i.e. bearish.

The 6-hour chart has improved since last week with VFI beginning to trend upward, but still needing to breach above 0 to offer a bullish reading. Also, the stochastic RSI and MACD offer a similar picture of near-term uptrend. However, price is still beneath the Kumo Cloud. If price can break above the Cloud, coinciding with VFI breaking 0, the bulls may wrestle back control.

On the 1-day chart, VFI, and stochastic RSI and MACD offer neutral readings, despite the trend being largely downward.
Additionally, the large Kumo Cloud support (green cloud) that has been tested several times over the past two weeks, is under attack currently. At the time of writing, price is barely above the Cloud, and briefly entered it last night. As mentioned prior, persistent testing of a support level, usually never ends well.
If the Kumo Cloud support breaks, declines to the low $7,000s cannot be ruled out.
Summary
The historical analysis of the momentum indicator suggests that price could fall dramatically in the near-term, before ultimately hitting a new bullish inflection point. However, given this dichotic reading has only happened once prior, readers may wish to discount this analysis given the small sample size (n=1).
Short-term technical analysis suggests that price could receive a near-term bounce, while longer-term technicals imply a similar viewpoint as the momentum and risk indicators.
Given these interesting times in the market and macroeconomy, we will continue to monitor our analytics and provide real-time updates in the Telegram channel when they become available.
Onward and upward,
Chris
-----