

Weekly Jab: Edition #4
MI remains neutral while technical analysis and risk indicators show bullish life.

“Markets are constantly in a state of uncertainty and flux and money is made by discounting the obvious and betting on the unexpected.”
- George Soros
Announcements
New Forbes piece, Bitcoin Interest Wanes As A Violent Breakout Looms, which looks at the different analyses and narratives around the inevitable price breakout for bitcoin.
New podcast with Florian Liss, Co-Founder of Staking Facilities, a non-custodial staking infrastructure company. Listen or Watch.
Signup for the Telegram channel here.
Momentum Indicator
The momentum indicator remains at the precarious 0.05 level despite the recent up move in price.

Risk Indicator
Last week, we performed some historical analysis on the MI, which yielded a potentially bearish outcome. However, as noted prior, that sample size was incredibly small (n=1), thus possibly not overly reliable. The aforementioned scenario is still on the table, but looks less likely this week as the risk indicator has bottomed.
The un-smoothed risk indicator bottomed around 0.10 and has begun an early stage uptrend. At the time of writing, the value is 0.15.
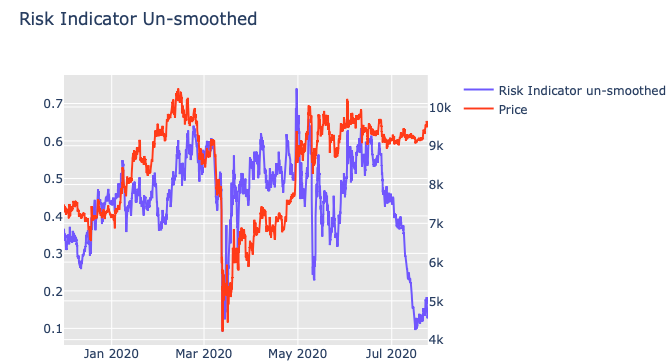
Additionally, the smoothed risk indicator (moving average) bottomed at 0.12 and has begun a small uptrend. At the time of writing, the value sits at 0.14.

Both risk indicators offer a potentially bullish outlook given their “bottoming” patterns both coincided with bitcoin’s recent uptick in price. Furthermore, the recovery initiated from deeply ‘oversold’ territory, which lends additional credence to a new bull wave.
However, despite the aforementioned, both uptrends are still in their infancy, thus we will be carefully monitoring them over the coming days for confirmation, i.e. breaking above 0.35.
Technical Analysis
As stated prior, bitcoin’s trading range has continuously tightened over the past two weeks, but finally broke out (slightly) to the upside, surging from $9,100 to a peak of $9,700. At the time of writing, bitcoin trades around $9,500.
The 4-hour chart shows the bulls back in control with price above the “point of control” (POC) level of $9,300, which can be seen as the red horizontal line on the chart below. Additionally, the volume flow indicator (VFI) and relative strength index (RSI) are both demonstrably bullish, including positive trends, VFI above 0, and RSI above 50.

On the 1-day chart, the signals are still bullish, but offer minor hints of cautiousness. As mentioned in prior weeks, the large Kumo Cloud support (green cloud) had been tested several times, but ultimately held with price surging to $9,700. Additionally, the surge pushed VFI and RSI out of their descending trends, which are both bullish.
However, given the sharp increase, RSI is currently nudging into overbought territory (above 70) while price is fighting to stay above the key $9,500 level. In the near-term, if price holds $9,500, it can retest $10,000. If it fails, then cloud support of $9,300 will likely be the next stop.

Summary
The MI still offers a neutral outlook given the value is stuck at 0.05 for the time being. However, the risk indicator has bottomed and begun an initial uptrend, thus offering an early stage BUY signal.
Currently, technical analysis suggests the bulls are back in control, but a brief “cooling off” period could be in store given the recent surge.
Unless a major negative event transpires, the longer-term technical charts and risk indicator seem biased to the bulls.
As always, we will continue to monitor our analytics and provide real-time updates in the Telegram channel when they become available.
Onward and upward,
Chris
-----